Module 12 // Proprietary Verification

Indicator Performance
Ledger & Proof of Work

Systematic accountability demands absolute mathematical transparency. Below is the active visual ledger verifying execution signals generated by our custom-built indicator suites across the Nifty Index complexes.
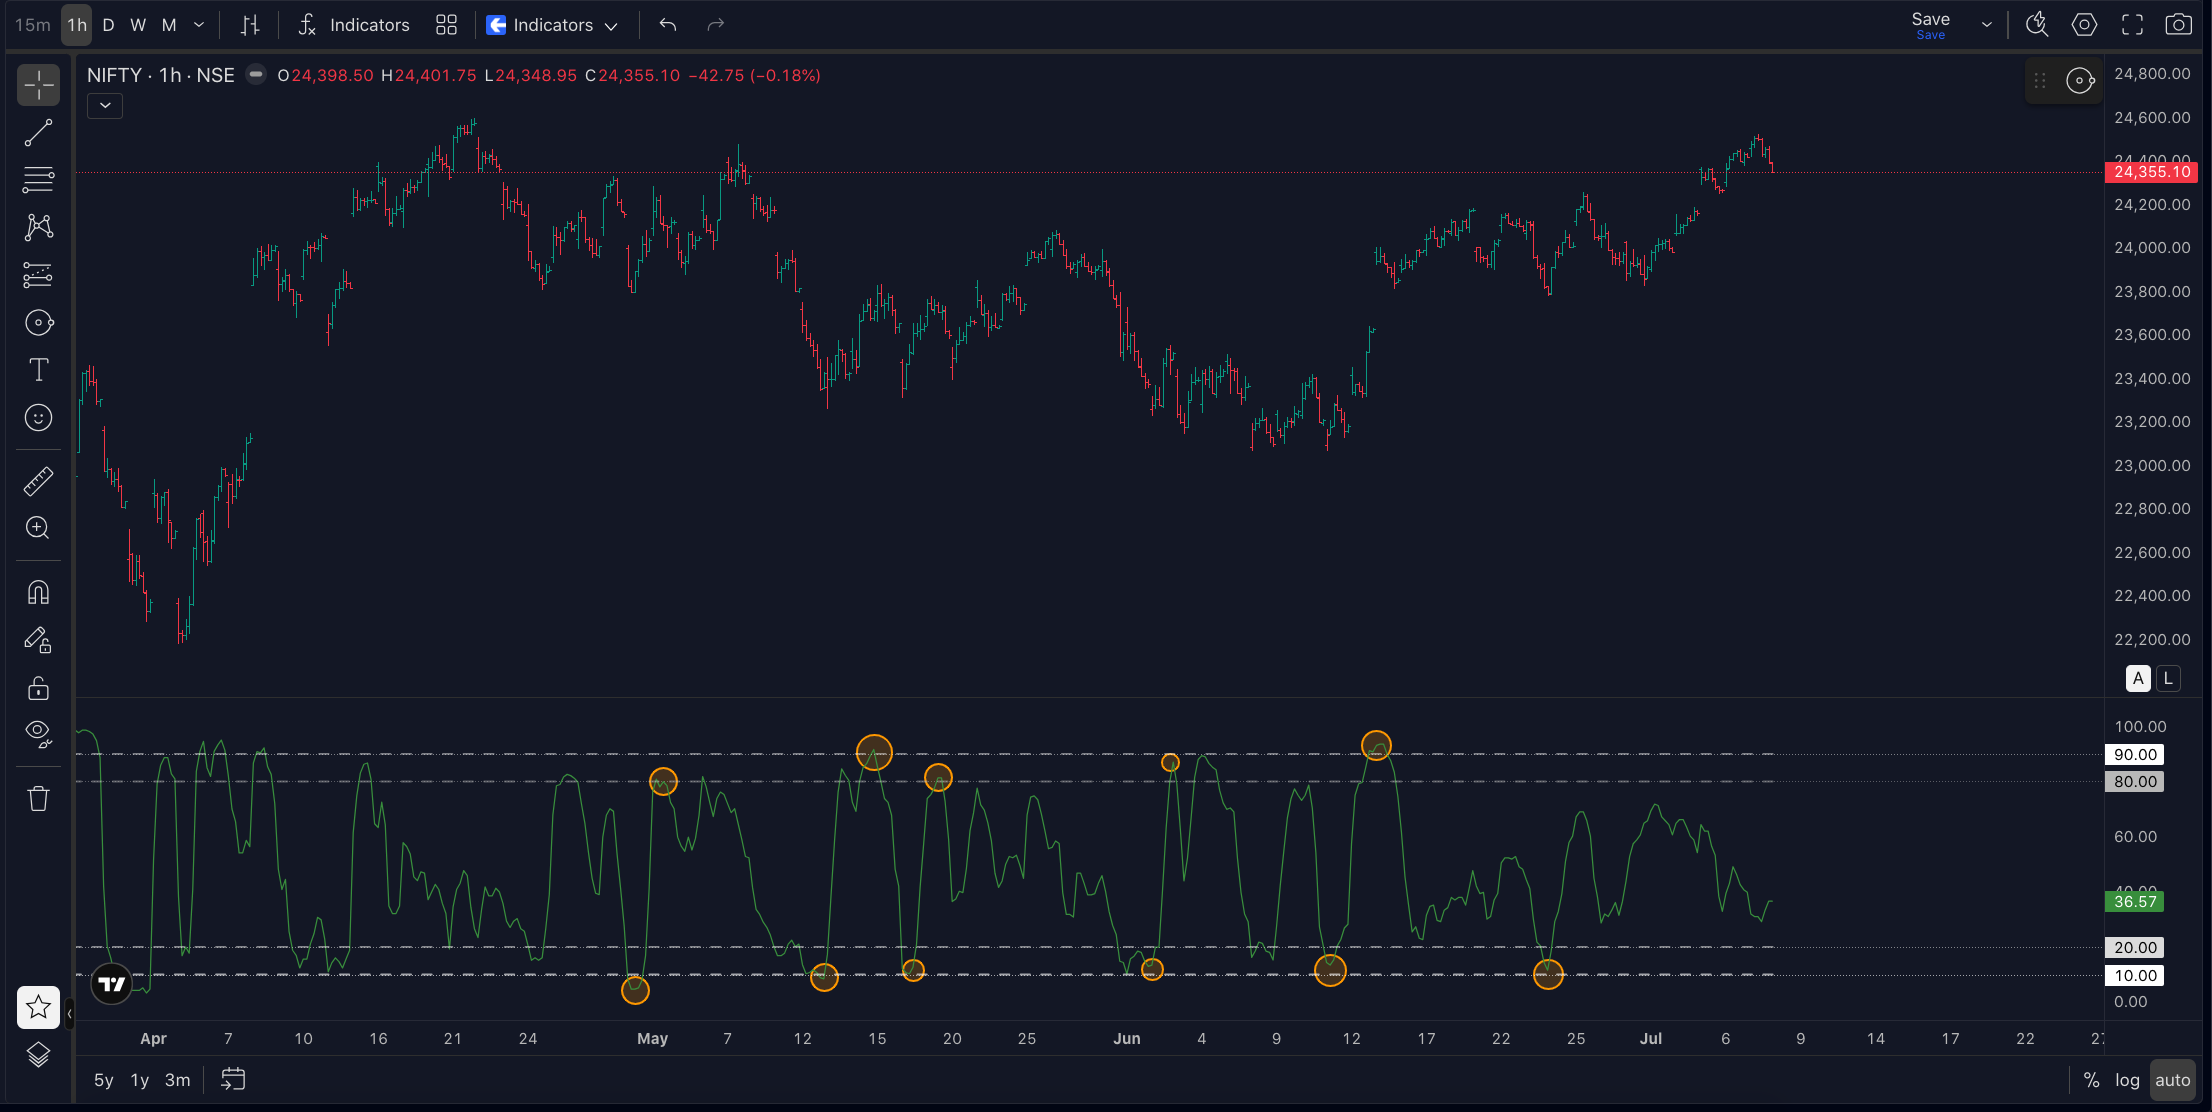
Weekly Indicator Execution Chart
⊙ CLICK CANVAS TO EXPAND SIGNALS
Monitored on a strict 1H timeframe. Capitalizes on fast mean-reversion theta decay. Automatically maps structural entry parameters to execute Next-Week ATM PE positions during extreme 10–20 indicator oversold gauges, and flips to short ATM CE contracts upon printing overbought 80–90 zone extremes.
Systemic Win-Rate
69.0%
Verifiable Last Trade Date
03 JUL 2026
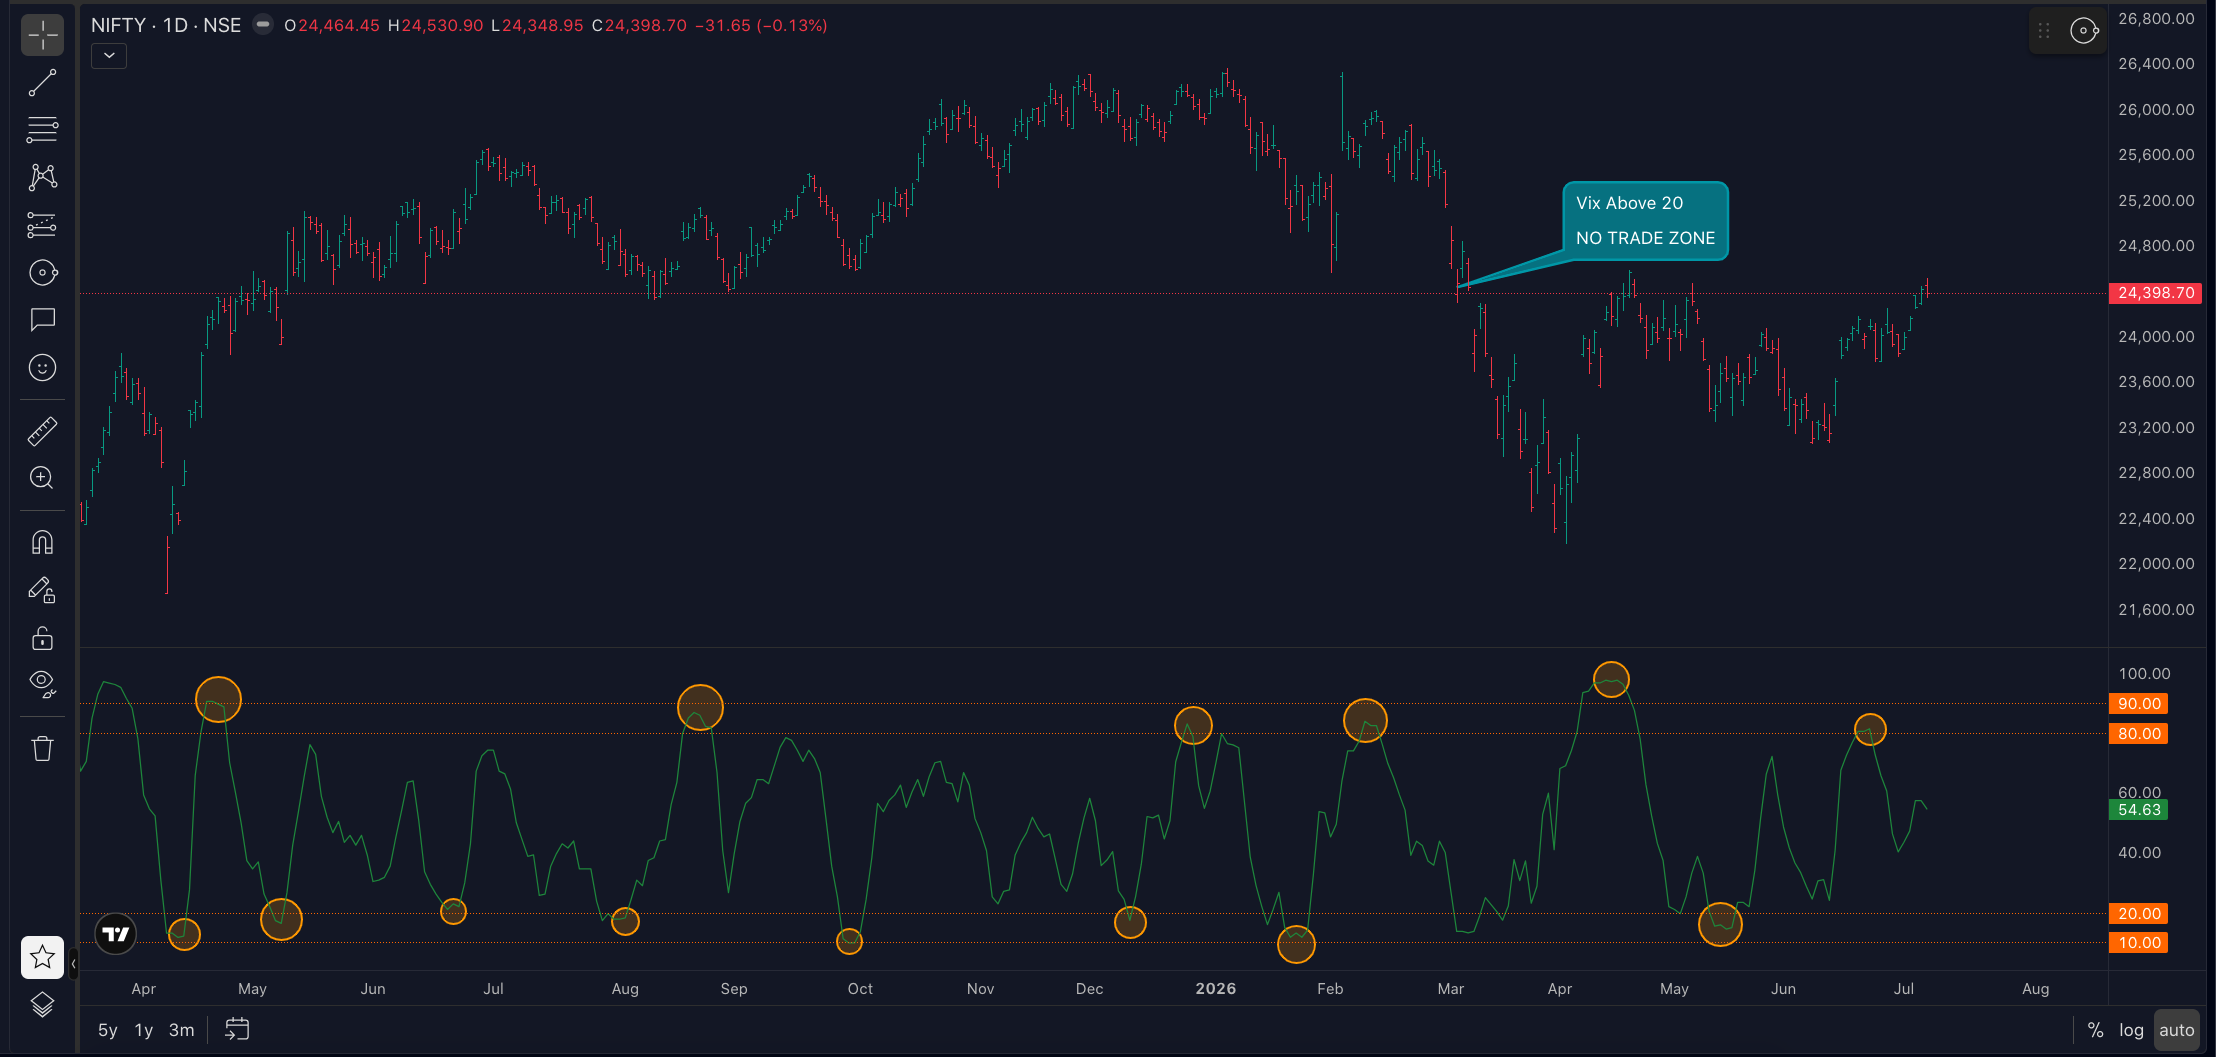
Monthly Indicator Execution Chart
⊙ CLICK CANVAS TO EXPAND SIGNALS
Monitored on a high-conviction Daily structural timeframe. Formulated to capture macro-regime time loops. Deploys position weight directly into Far-Month ATM PE setups when the indicator sinks to the deep 10–20 valuation arc, while strictly implementing an automatic asset protection cutoff whenever India VIX breaches the 20 line.
Systemic Win-Rate
74.2%
Verifiable Last Trade Date
25 JUN 2026